Appearance
Charts & Visualizations
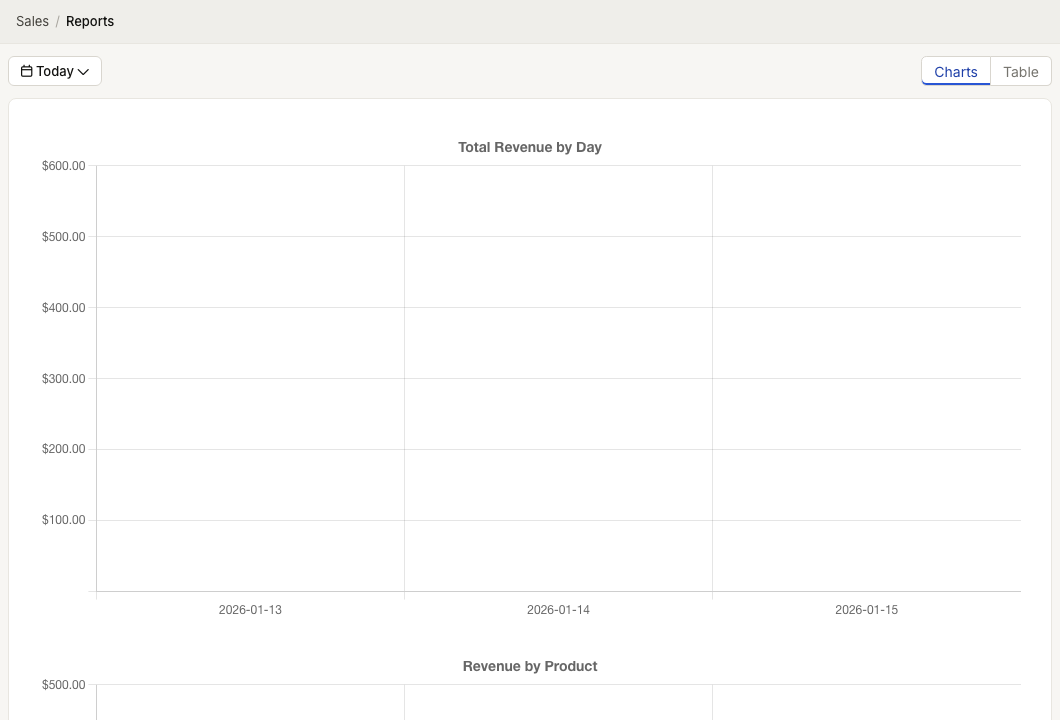
WebWorkstationMobileCharts in ZynoSales > Reports provide a visual summary of product sales for the selected date range. Use them to spot patterns quickly before switching to the table for exact row-by-row values.
Permission required
You need ZynoSales reports view access.
Open charts
- Open ZynoSales > Reports.
- Choose a date range.
- Select Charts in the view switcher.
The charts update when the report date range changes.
Available charts
| Chart | Shows | Use It To |
|---|---|---|
| Total Revenue by Day | Revenue grouped by day in the selected range. | Spot high and low revenue days. |
| Revenue by Product | Revenue by product. | Find top revenue products. |
| Quantity by Product | Units sold by product. | Compare volume separately from revenue. |
All charts are bar charts.
Reading charts
- Hover or tap a bar to see the value.
- Use the date range filter to compare different periods.
- Use Table view when you need exact product rows, quantity, revenue, and profit.
- Use Daily Closeouts when you need accounting or location-level reconciliation totals.
Common issues
| Problem | What To Check |
|---|---|
| Charts show no data | Confirm the date range includes sales activity. |
| Product quantity and revenue rank differently | Higher-price products can lead revenue while lower-price products lead quantity. |
| Daily total differs from closeout review | Reports are product-sales focused; use Daily Closeouts for reconciliation. |
| Chart labels are crowded | Narrow the date range or switch to Table view. |