Appearance
ZynoSales Reports
WebWorkstationMobileZynoSales Reports show product sales performance for a selected date range. Open reports from ZynoSales > Reports.
Permission required
You need ZynoSales reports view access.
Choose a date range
Use the calendar button in the toolbar to choose a date range. The default is Today. ZynoSuite remembers your recent report range preferences.
Charts view
Choose Charts to see:
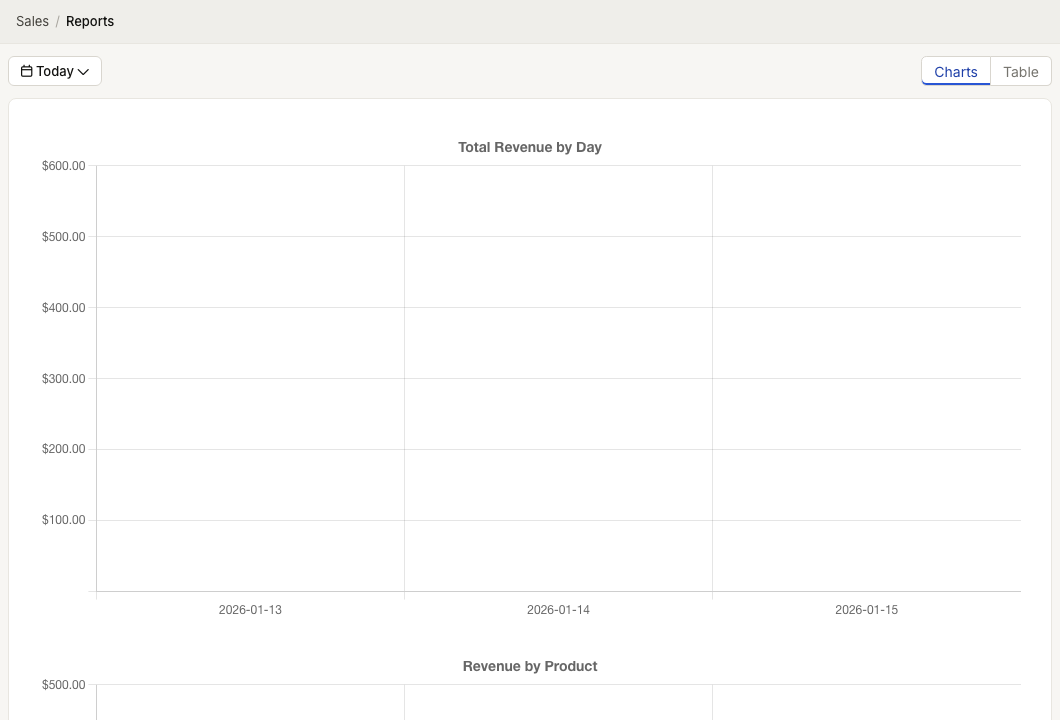
| Chart | Shows |
|---|---|
| Total Revenue by Day | Revenue grouped by day |
| Revenue by Product | Revenue for each product |
| Quantity by Product | Quantity sold for each product |
Charts are useful for spotting patterns quickly.
Table view
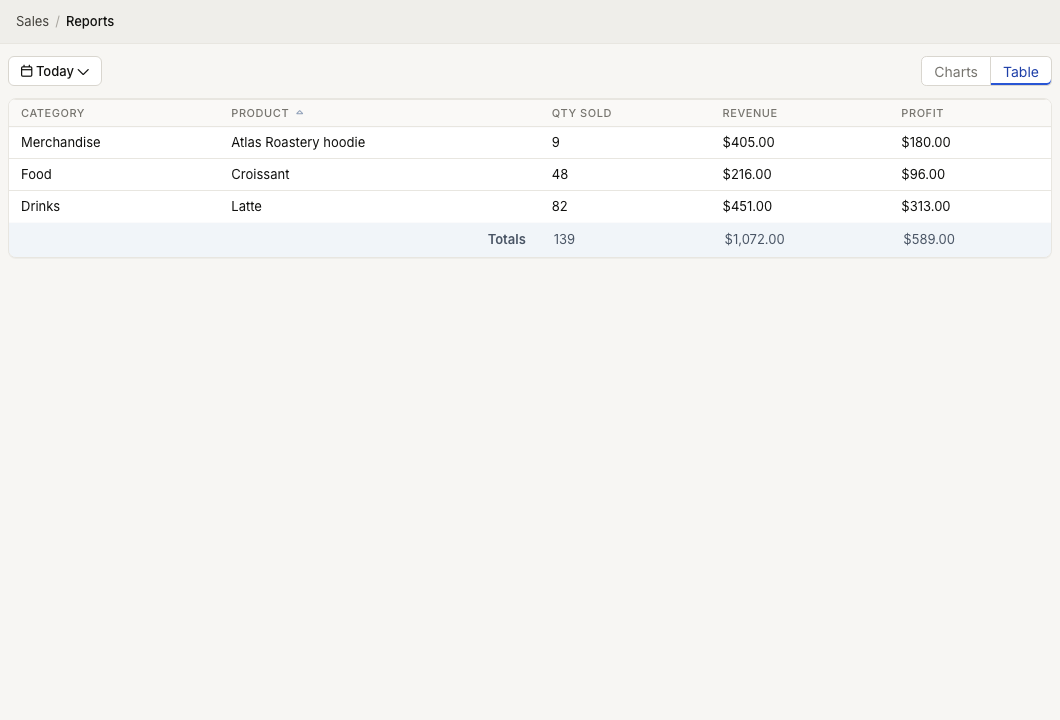
Choose Table to see rows by product.
| Column | Meaning |
|---|---|
| Category | Product category |
| Product | Product name |
| Qty Sold | Units sold |
| Revenue | Product revenue |
| Profit | Profit when available |
Use column headers to sort the table. The footer shows totals for quantity, revenue, and profit.
How to use reports
Use ZynoSales Reports to:
- Review top-selling products.
- Compare product quantities and revenue.
- Find low-volume products.
- Check daily sales movement.
- Support inventory and purchasing decisions.
For reconciliation and accounting totals by location and payment type, use Daily Closeouts instead.